Analysing Your Facebook Messenger Chat

An insight to a part of your data that Facebook has
Facebook always provided an archive of your data which it stores. It came into light when the Cambridge Analytica data breach event happened. In my opinion I feel that Google stores more user data than Facebook for a user. I found that all my searches not on Google but even on external sites such as GitHub were stored by Google. Although this data can be deleted but still this data is there and just with a combination of username and password can be accessed by anyone.
The Idea
I was fascinated by Data Visualisations and wanted a start. So months before the Cambridge Analytica event happened, it came into my mind to plot a graph of my chat with my Facebook friend. So the idea was to plot the total number of messages sent or received in a day. I usually code in python and knew about one plotting library matplotlib.
Getting Started: Collecting chat data
So finally after deciding what to do and what technologies to use, the main task was to get all the messages from a chat. One thought was to scrape the complete chat but scraping wouldn’t have been efficient and in the case where number of messages were in thousands, it would have taken hours to scrape a single chat. Also, this could have imposed a temporary ban on my IP address as scraping is something no website supports. I already had an experience of temporary ban from Reddit while learning web scraping, and I didn’t want to do that again.
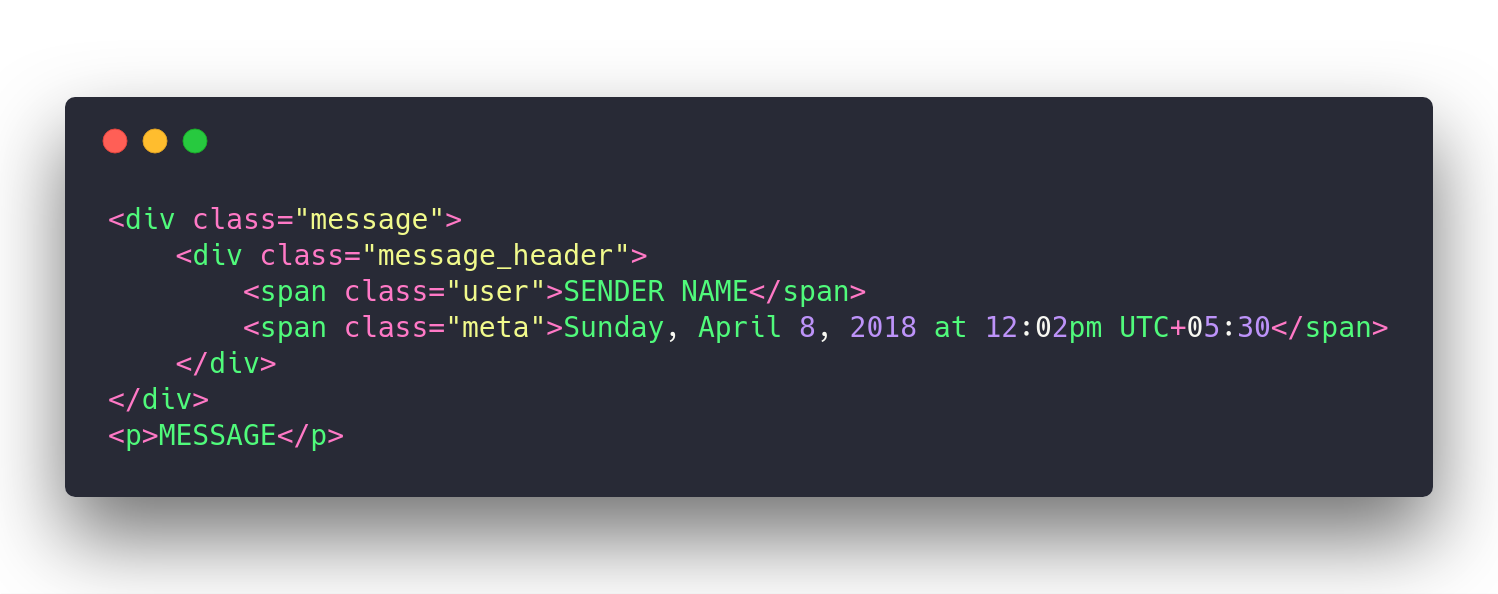
Then I remembered that Facebook provides an archive of user data, I tried giving it a shot. Luckily, when I extracted that zip, I found an html page for messages which had all my chat listed with each person and group till the time of data request. Each name was an html page with complete chat with that user. The code of each html was minified so it had to be unminified to analyse what was written there. On unminifying the html, it was clear that the code inside each html file of the chat was in a generic format with each message inside a div with class ‘message’. The message div has sender’s name, message time stamp and the message with each enclosed in an individual span tag. Sender’s name is in a span with class user, timestamp in a span with class meta and the message content in a paragraph ‘p’ tag.
Step 1: Extracting message dates
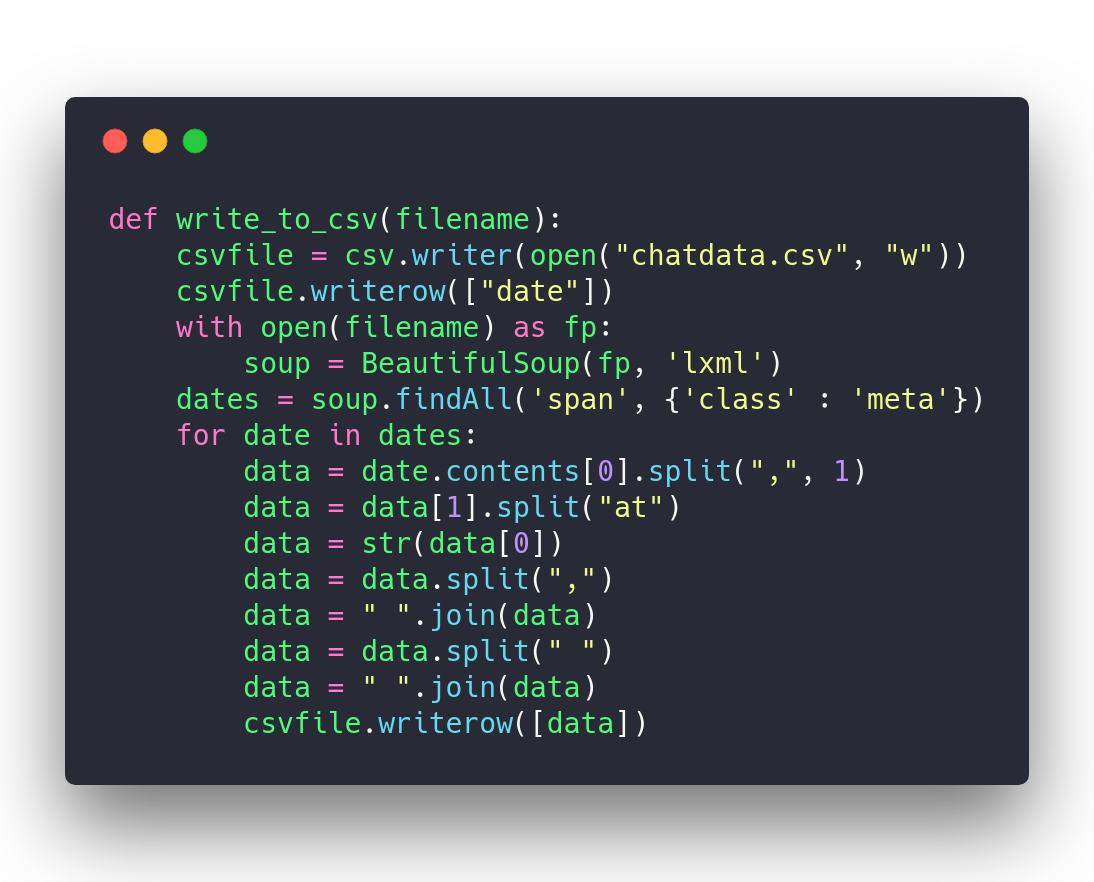
Now I had the complete chat with me in an html format which just needed to be scraped to get the data. I used beautiful soup to get the timestamp of each message and dumped that data in a csv file “chatdata.csv”. This process takes 4–5 seconds only for the case when there are a lot of messages else it is almost instant. Up to this point, the csv is in a pretty bad condition with redundant values i.e multiple rows for the same timestamp.
Step 2: Counting messages on a given date
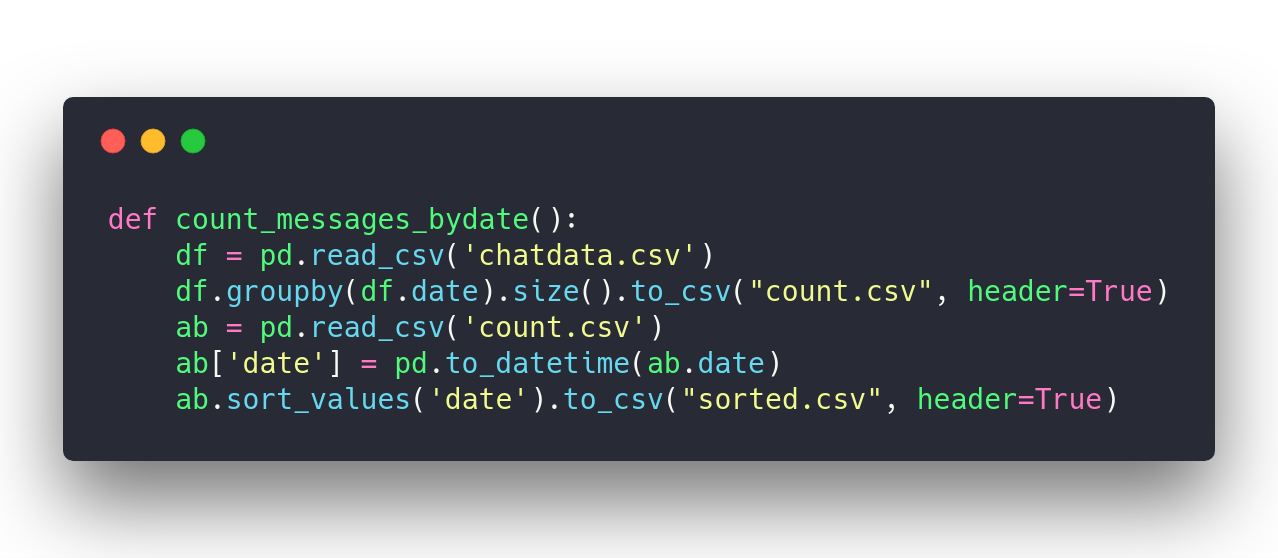
The next task was to count the number of messages sent on a single day. I used pandas library to do it. The dataframe was the complete csv. I used groupby function to group the rows according to a particular date. After this step, I had all the dates on which the message was sent and the count of messages sent on that day exported to “count.csv”. The only step remaining was to sort the dates in ascending order so that graph is plotted in an ordered manner.
Step 3: Sorting the data
By using sort_values function in pandas library I sorted the count.csv from the previous step in ascending order of dates. The timestamp originally contains date and time in the format Sunday,April 8,2018 at 12:02pm UTC+5:30. So while creating the “chatdata.csv” I extracted only the date from the timestamp and while creating the final sorted.csv the date is converted to YYYY-MM-DD format using to_date function in pandas library. The “sorted.csv” is the data file which has the count of messages on a given day in ascending order of dates. The final task remaining is to plot these two columns on a graph.
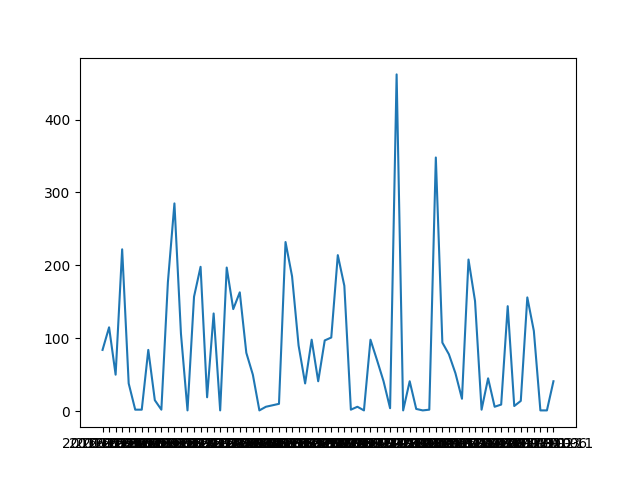
Final Step: Plotting graph and running the script.
To plot the data, I used matlplotlib library. I kept dates on x-axis and the count of messages on that day on y-axis.
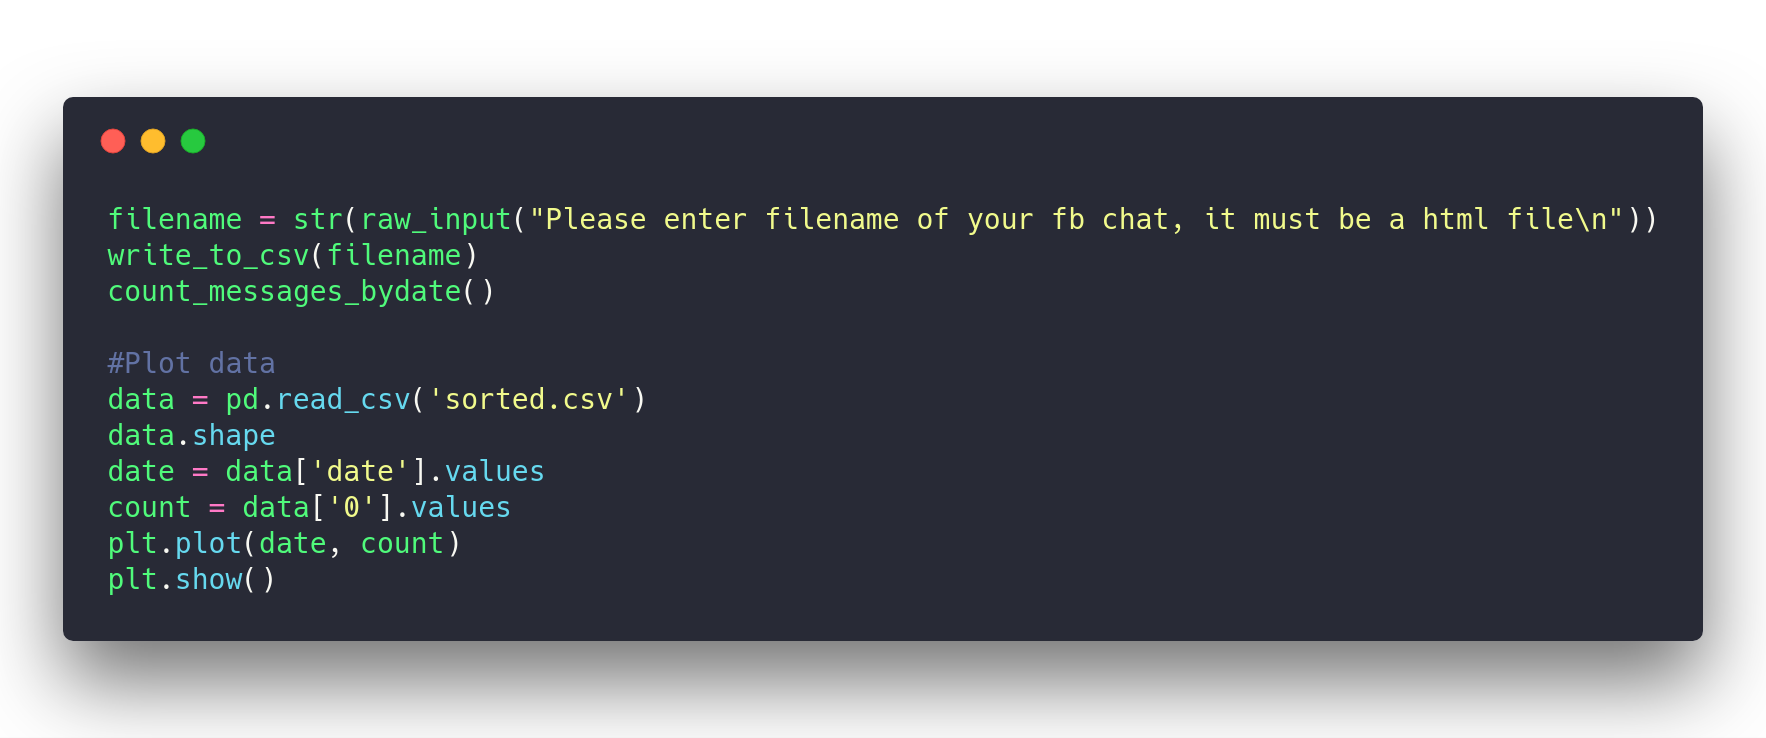
Now it was time to give python script a test run and Voila! the output was there on the screen. It was fun to test the script on different chats and comparing the graph among them.
Final Words
The source code for the complete script can be found here at GitHub.
The code was written in a small time and hence has bad variable naming and creation of 3 files. I believe number of files generated can be reduced to 1 or 2 and the complete code can be made more better by incorporating more features. Also the x-axis containing dates gets cluttered because of less space and big length of date which needs to be corrected. The script currently plots count for only the days when message was sent or recieved, there is no point for any day when no message was sent or received i.e 0 messages in a day, the plot will be more better if those days are also accomodated. Any contributions to code are welcome.